Debugging an mruby Heap Corruption in Artichoke with Pernosco
Artichoke is an alternative Ruby implementation written in Rust and Ruby that has an mruby core. Artichoke is slowly eating away at this mruby core and replacing it with components written in Rust (1, 2).
Segfaults and memory corruption have been part of the process of executing a rip-and-replace. Artichoke also stresses the mruby VM in novel ways by throwing a lot of weird code at it as part of measuring ruby/spec compliance.
I recently used the Pernosco debugger to diagnose and suggest the exact fix to upstream mruby for a complex corruption of the mruby heap that spanned multiple GC cycles.
What is Pernosco?
Pernosco is a hosted omniscient debugger. I got access to Pernosco for the Artichoke open-source repo by responding to a tweet from @rocallahan as part of a program to give open source projects access to Pernosco with a GitHub Actions integration.
Pernosco is a powerful hosted wrapper around rr and can replay recordings of
programs on Linux. It looks like this:
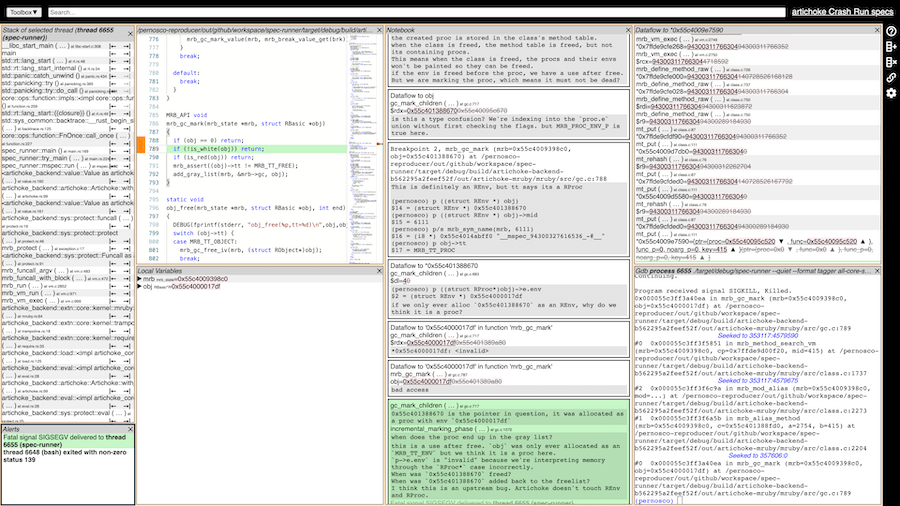
The Pernosco interface is structured as a series of panels. The UI chrome has a Toolbox selector that lets you mix and match panels. In the screenshot above I have the current thread’s stacktrace, an Alerts panel which shows Pernosco’s estimation of the most interesting points in the program’s recorded execution (here it shows the SIGSEGV), a source code browser which shows the current stack frame, a Local Variables view which feels like the IntelliJ debugger, a Notebook for annotating lines of code at a specific point in the program’s execution, a Dataflow panel which tracks values as they make their way through memory and registers, and a real gdb shell.
This Pernosco debugger is some intense dark magic that gives you the ability to time travel through the entire execution of a program as if it is still running. Things like calling arbitrary functions in gdb and setting watchpoints work as if the program is running.
Pernosco also has a nifty dataflow view which shows all writes made to a given address over the entire exeucution of the program to the current point in the recording.
My Experience with Interactive Debuggers
I am not comfortable using an interactive debugger. I do not really ever set breakpoints, I have never set a watchpoint. I have used LLDB on my Mac before to debug crashes in Artichoke, but that mostly involves letting the program crash and looking really hard at the stack trace.
It turns out you can fix segfaults this way! I did it in artichoke/artichoke#1323 where I identified the source of an invalidated pointer that had an interleaving garbage collection. You can do it this way, but it is really hard. This bug took months of coming back to it to crack.
Interactive debuggers I enjoy using include pry and pdb, but mostly because setting breakpoints is easy (just modify the source).
Despite not being comfortable debugging native code with an interactive debugger, Pernosco made me feel confident and gave me super powers.
The Bug
I have encountered several crashes that implicate the mruby GC while working on Artichoke and they are quite tricky. They usually have required a complex bit of timing that interleaves a pointer invalidation with a GC at the wrong time. This bug was of that shape, but much more complicated than the ones I already had practice with because it spanned multiple GC cycles.
The mruby GC
mruby in its default configuration has a generational, tri-color GC. During an
incremental GC, black objects in the heap are walked and color objects gray. All
reachable objects are eventually painted black. At the end of the incremental
scan, objects that are white have their inner contents freed and the RBasic *
containers are moved back to the freelist managed by the GC to be reused later
for new objects.
A full GC works the same way, but it begins with a root marking phase that
starts marking long-lived classes in the old generation such as Object and
Numeric.
Root Cause
The crash is caused by a type confusion because an RBasic * is owned by
multiple other objects despite having been freed once by the GC, but this is
easier to describe with the timeline of writes to the implicated object.
- During interpreter boot, the
-@(unary minus) method is defined on theNumericclass.Numericis the root of Ruby’s numerical tower. - During a full GC after interpreter boot, the
Numericclass is moved to the old generation. This means it is only marked during the root marking phase of a full GC. - Sometime much later in the program’s execution:
- An object
objis created from a subclass ofNumeric. obj.respond_to? :-@is called which pulls theRProc *(generated bytecode) forNumeric#-@into the method cache.obj.singleton_class.alias_method :some_other_symbol, :-@is called which converts theRProc *forNumeric#-@to have itsefield be anREnv *variant.- When attaching the proc to
obj’s singleton class, a write barrier is called on the newly allocatedREnv *onobj.
- An object
- Then the object and its singleton class become unreachable.
- Then a minor GC occurs:
- Because the GC is minor, a root scan phase does not occur, which means
Numericand theRProc *s in its method table are not marked. - This causes the
REnv *from the prior alias call to not be painted black. - The
REnv *isfreed but is still owned by theNumericmethod table. - The
REnv *’sRBasic *is returned to the freelist in the GC heap to be reused.
- Because the GC is minor, a root scan phase does not occur, which means
- Sometime later but before the next full GC, the previously freed
RBasic *is reallocated as anRProc *. (This means theproc->efield on theNumeric#-@proc is now anRProc *instead of the expectedREnv *. - The newly allocated proc is then involved in an
mrb_alias_methodcall which writes toe->midand corrupts theenvin theRProc *which is pointed to byNumeric#-@. - When a full GC finally occurs, the
RProc *s in theNumericmethod table are added to the gray list. When the GC attempts to mark theNumeric#-@proc’sREnv *ingc_mark_children, a type confusion occurs causing an invalid memory access at an unaligned (garbage) address.
This is a pretty wild bug with lots of moving pieces. I never would have been able to figure this out with my standard approach of staring very intently at stack traces.
What is even more wild is that I was able to exactly state the one line change required to fix the issue, which @matz confirmed in my bug report.
Using Pernosco to Find the Bug
In this section, I will describe some techniques I used in the Pernosco shell to build a timeline and isolate the bug.
Alerts
The place I started was the alerts view, which placed me at the point in the mruby stack where the invalid memory access ocurred. Stepping backward brought me in to Rust’s SIGSEGV handler for detecting stack overflows which caused some flailing in the Rust community Discord. Continuing to step backward brought me into the mruby garbage collector’s marking phase during a root GC.
At this point I could see what what data type mruby thought it was freeing, and I could see the unaligned address it was marking.
Dataflow
The dataflow panel contains all writes to an address over the lifetime of the program up until that point in the program’s execution. It looks like this:
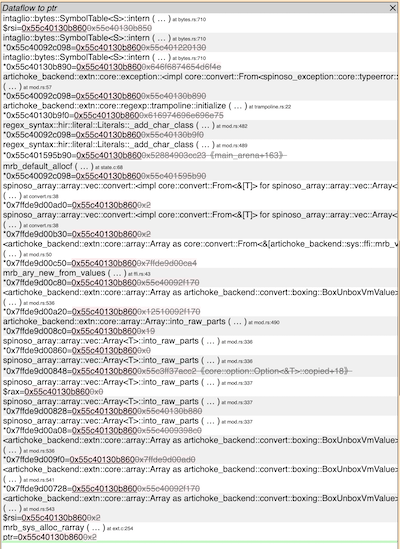
Using this tool required a lot of trial and error to find the correct RBasic *
to trace. Once I zeroed in on the correct objects, I used this panel extensively
to hop around and poke at things in the local variables panel and the gdb
shell.
The dataflow panel is the core magic of the omniscient debugger. It lets you teleport across time and stacks. Stepping forward and backward in gdb when time traveling (and up the stack) allowed me to piece together what was happening in the mruby VM.
Notebook
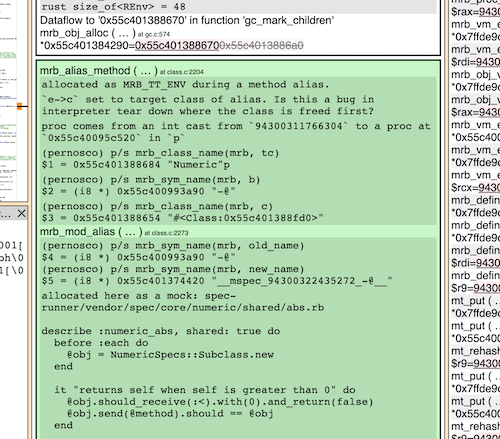
When hopping around in the dataflow panel, I was brought to a particular stack frame at a particular point in the program. Clicking around in the source code view allows you to annotate this line of code/point in time pair in a free form notebook. Writing in the notebook also gives you a bookmark to this code/point in time.
Local Variables
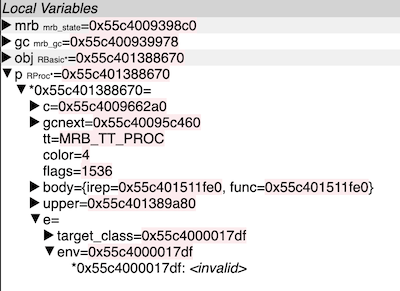
The locals panel lets you poke at the declared variables in the current stack frame as they are at the current line. This part of Pernosco was the most familiar to me; it feels like IntelliJ or VS Code.
One nice thing is that it lets you peer through C unions as any of the variants.
The screenshot above shows the corrupted REnv * as the variant the GC marking
phase is interpreting it. There’s our garbage pointer!
This panel was also what caused me to drop into the gdb shell most frequently.
The panel did not allow me to define arbitrary expressions. My biggest
frustration is that the locals panel does not allow you to cast pointers.
mruby uses type punning to specialize RBasic * slots in the heap as one of
many other types like RClass *, REnv * and RProc *. If I had an RBasic *
in this view, I could not reinterpret the pointer to poke at its guts.
gdb shell
Pernosco gives you a real gdb shell that lets you do anything you could as if you were debugging the program live. Setting breakpoints, watchpoints, and calling arbitrary C functions.
With the gdb shell, I was able to get at the exact line of Ruby code that triggered the first alias call at the beginning of the bug timeline. This was mindblowing since I was able to trace the Ruby code and use that to back solve to the native functions being invoked in the VM.
I did try to cheat and set a watchpoint on the address that was corrupted, but this was too slow to be a fruitful approach.
Sharing
Pernosco sessions are sharable. Once I had investigated, I was able to share my debugging session and all annotations with upstream, giving the mruby maintainers a head start and reproducer for continuing the investigation.
Conclusion
Pernosco is an amazing tool. I felt like I was living in the future using it and it made me a confident and competent user of an interactive debugger. With one crash I was able to track down and fix a very complicated GC timing bug.
Pernosco is available to open source projects via a GitHub Actions integration. Reach out to inquiries@pernos.co.